Where rental properties
still cash flow in 2026.
We tested a typical home in 340 large U.S. cities with current values, rents and financing. Only 6 produced positive first-year monthly cash flow under the same full-expense model.
The central finding
At current typical prices and rents, positive cash flow is rare among large U.S. cities when the model includes financing and a complete operating budget. With 25% down and a 7.03% 30-year mortgage rate, only 6 of 340 cities, or 1.8%, remain above zero.
The median city in the study loses $1,195 per month. That does not mean every rental in those markets loses money. It means the typical citywide price and typical citywide asking rent do not produce positive cash flow under these assumptions. Individual deals can perform differently because of purchase discounts, property type, condition, achievable rent, financing and management choices.
Cash flow has become a deal-level outcome rather than a safe assumption about an entire city. Investors need either an unusually good purchase price, rent above the local norm, more equity or lower costs.
The strongest large-city results.
The six positive markets cluster among lower-price Midwestern and Southern cities. The chart continues through the ten strongest results to show how quickly the model crosses below zero.
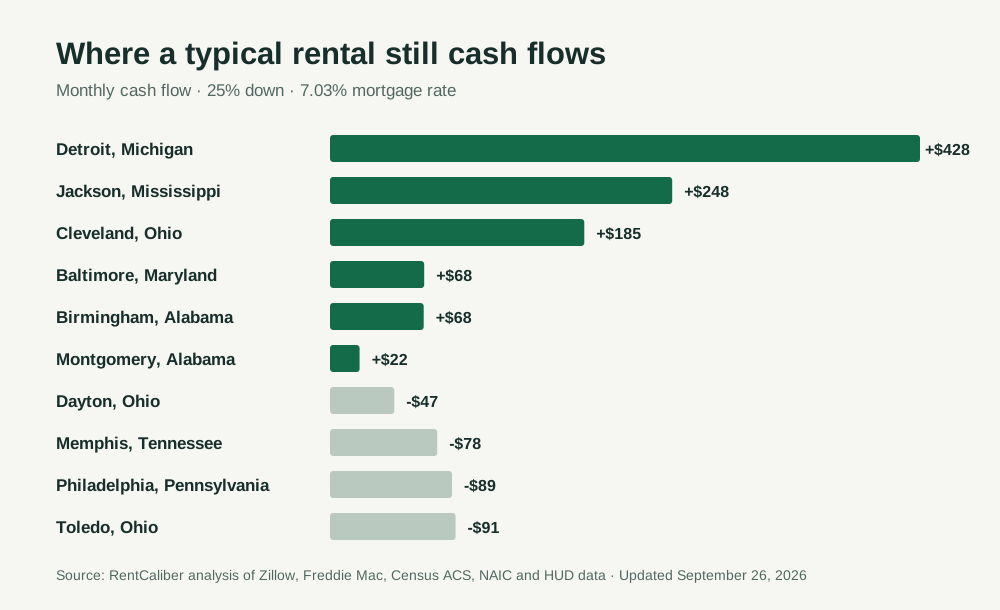
The 6 cities above zero.
These are the only large cities in the current sample where the modeled typical home covers operating expenses, reserves and mortgage payments.
| # | City | Typical value | Typical rent | Modeled cap rate | Monthly cash flow |
|---|---|---|---|---|---|
| 1 | Detroit, Michigan | $77,199 | $1,341 | 13.71% | $428 |
| 2 | Jackson, Mississippi | $86,367 | $1,265 | 10.34% | $248 |
| 3 | Cleveland, Ohio | $120,419 | $1,391 | 8.54% | $185 |
| 4 | Baltimore, Maryland | $186,741 | $1,802 | 7.02% | $68 |
| 5 | Birmingham, Alabama | $136,876 | $1,322 | 7.18% | $68 |
| 6 | Montgomery, Alabama | $152,837 | $1,338 | 6.70% | $22 |
A positive model is a screening result, not a recommendation. Neighborhood, condition, insurance availability, taxes, regulation and tenant demand can differ materially within each city.
Financing changes the map.
Cap rate is independent of financing, but cash flow is not. At 25% down, the number of positive cities moves from 8 at 6.03% interest to 5 at 7.53%. A larger down payment improves monthly cash flow, but it also places more investor capital into the deal.
The live city ranking contains the full rate-and-down-payment sensitivity table. Because Freddie Mac's rate updates weekly, the study recalculates automatically rather than preserving a stale financing snapshot.
A second rent source supports the direction.
340 of the 340 cities matched a HUD FY2027 two-bedroom Fair Market Rent area. 312 matched cities had Zillow rent within 25% of HUD's figure. Rerunning the model with HUD rent produced positive cash flow in 5 cities.
HUD and Zillow measure different things: HUD reports a 40th-percentile gross two-bedroom rent for a broader area, while Zillow estimates typical asking rent across homes and apartments in a city. Agreement is not expected, but the comparison helps identify implausible inputs.
Methodology
Sample. U.S. Census places with at least 100,000 residents, a detailed RentCaliber profile, current Zillow home value and rent data, and a usable effective property-tax reference. The final sample contains 340 cities.
Purchase price and rent. We use Zillow's August 2026 Home Value Index and Observed Rent Index. These represent a typical citywide value and typical asking rent, not the same individual property.
Taxes and insurance. Property tax applies the Census ACS 2024 city effective rate to the current Zillow value. Insurance uses the NAIC 2023 state average HO-3 premium plus 25% as a landlord-policy planning estimate. It is not a quote.
Financing. 25% down, a 30-year amortizing loan and Freddie Mac's 7.03% weekly average as of September 24, 2026. Investment-property rates are often higher, so the sensitivity analysis also tests higher rates.
Operating assumptions. 5% vacancy, 5% maintenance, 8% management and 5% capital reserves. HOA, rehabilitation, other income and other costs are set to zero because no consistent city-level source exists.
Quality control. Cities are held out when Zillow rent changed more than 30% in a year or differs sharply from HUD Fair Market Rent. Name matches are rejected when the current Zillow figure is implausibly far from the Census median. Missing data is excluded rather than estimated.
Limitations
- Citywide indexes do not describe a specific listing, neighborhood or property type.
- Zillow value and rent indexes describe typical but not necessarily identical properties.
- The model excludes appreciation, income taxes, depreciation benefits and sale proceeds.
- State insurance and city tax references are planning inputs, not property quotes or assessments.
- Local regulation, crime, employment, condition and tenant demand require separate research.
Sources
- Zillow Home Value Index and Zillow Observed Rent Index (August 2026)
- Freddie Mac Primary Mortgage Market Survey, week of September 24, 2026
- U.S. Census Bureau ACS 2024 5-year estimates
- NAIC 2023 Homeowners Insurance Report
- HUD FY2027 Fair Market Rents
Suggested citation: Castellanos Serrano, Javier. “Where Rental Properties Still Cash Flow in 2026.” RentCaliber, updated September 26, 2026. https://rentcaliber.com/research/rental-cash-flow-2026/.
Ready to test an actual listing instead of a citywide baseline?
Analyze a property →